
Question:
How to get to an industrially self-sustaining Mars settlement in the minimum time?
Previously I've approached the broader problem in a book (http://www.caseyhandmer.com/home/mars) and several blogs, focused on a transport roadmap (http://caseyexaustralia.blogspot.com/2017/05/a-roadmap-to-industrially-self.html) and potential sources of money
(http://caseyexaustralia.blogspot.com/2017/09/how-to-fund-space-settlement-where-does.html). In this blog I'll attempt to integrate previous knowledge and make projections about time frames and costs.
Edit: Now all the data is available (csv) so you can slice and dice it.
Edit: Now all the data is available (csv) so you can slice and dice it.
In the previous post, I used the following graph to explain the relationship between population and self-sufficiency under a variety of scenarios, including constant and linearly increasing cargo capacity. It turned out that the final result did not much depend on how many rockets were available when, but the timescale certainly does. In this blog, I will build on the SpaceX exploration architecture. The most fundamental bottleneck is the rate of rocket construction and launch, so we will explore how construction rate affects the population and self-sufficiency timeline.
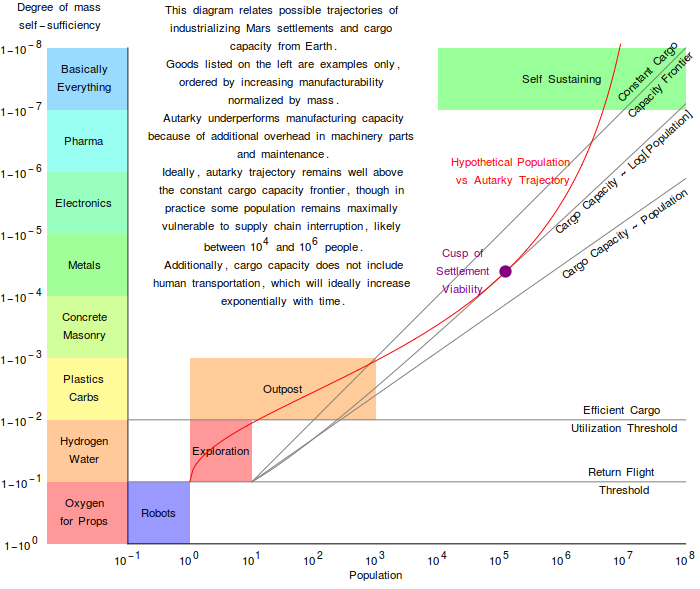
This graph shows a schematic relationship between population (horizontal axis) and mass self-sufficiency (vertical axis) under a cargo-constrained Mars settlement scenario. The settlement begins at the bottom left and scales towards the top right, where at some population likely exceeding a million people they are sufficiently industrially diverse that they no longer depend on crucial technology to be shipped from Earth.
Before I dig into actual numbers, I'm going to state my assumptions. For better or for worse, a lot of space-exploration themed writing, technical or otherwise, does not hew to the best possible standards for rigor. Here, I'm not going to delve into religious disputes about asteroid mining, lunar fuel stops or any other peripheral concept that's not related to the core bottlenecks.
There are two primary phases of the settlement timeline. The first, corresponding to the region of the red line below the purple cusp in the diagram above, marks the phase where scaling population within the limits of cargo shipments is a growing challenge. Loosely speaking, this challenge peaks with the successful instantiation of ore mining and refining for every industrially relevant metal and chemical - requiring interaction with the raw, unfriendly Mars environment. This phase is also the phase most directly applicable to current technology and projections.
Assuming the first phase proceeds more or less as planned and everyone doesn't die, the second phase marks the rush from the cusp to full industrial independence. By this point in the program, at least decades after initial landings, technology at every point of the exercise will have evolved to the point where predictions are difficult to make in 2017. Specifically, I expect that the forcing function of extreme Mars labor scarcity will result in drastic improvements in rockets, automation, manufacturing, and so on. It is possible, even likely, that this flowering of technology will reduce the minimum viable technology population more rapidly than ever-expanding immigration increases it.
That is, at the point of the cusp perhaps 20 years after initial landings, best estimates may still place the minimum viable population at 10 million, at least 30 years away even if the population doubles each launch window. At that cusp, net immigration could be in the tens of thousands per window but will have to increase to 100x that, something I think it rather unlikely.
Instead, rapid improvements in extraction and manufacturing technologies will reduce the minimum viable population to less than a million and perhaps less than the tens of thousands. As this trend continues, it will be possible to launch entire self-sufficient cities in one go, and perhaps a few decades later Mars will have thousands of self-sufficient towns, even though the total population may never reach the 10 million originally required.
It is important to emphasize that self-sufficiency is represented in reality as more capability than practice, since trade will always help increase overall economic efficiency.
I will sketch a picture of phase two, but first I will provide some numbers. Afterall, if the first self-sustaining settlement doesn't get built, there'll be no way for the ones that come after.
Phase One
As I explain in my book, the hard part is getting rockets from Mars to Earth, and to a lesser extent, from Earth to Mars. Here, I'll explain the constraints on total shipping capacity, then build a model that creates a plausible shipping capacity roadmap.
A spaceship has a number of important properties.
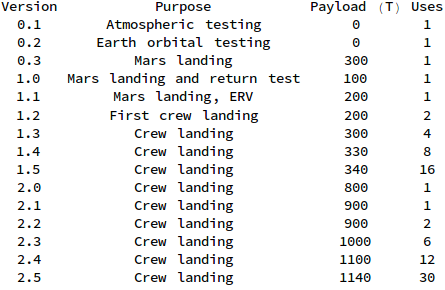
Cargo capacity to the Martian surface. Based on the IAC2016 talk and subsequent tweets, initial SpaceX Mars ships will have a cargo capacity of around 300T to the Martian surface. Second generation ships may increase this to around 1000T, but further increases are limited by a variety of physical constraints including the thinness of Mars' atmosphere.
Whether it can be reused and rate of reuse. The Mars ship is composed of a space ship, a tanker, and a booster. Initial boosters and tankers will be flown 6-30 times to refill the spaceship. The first spaceship will fly to Mars, spend nearly 2 years on the surface making propellant, then fly back to Earth. While the first few spaceships will be put near the Smithsonian, later spaceships will be able to fly to Mars every launch window after the emplacement of a fuel/ox plant and storage by the launch zone. Much later, improvements in engines could permit two flights to Mars per launch window. Over this time, the total number of Mars flights a spaceship can perform before retirement will also gradually increase.
Rate of construction. These spaceships are super complicated and difficult to make. Initial spaceships could easily take multiple years to build. Over time, the construction time will decrease and a single line can make more of them per launch window, increasing the total number of spaceships. Additional parallel lines can be built, perhaps by other space agencies using related technology, which also increases the total number of spaceships.
So how many spaceships are there per year?
To answer this question I built a Mathematica model that takes as inputs a function for the construction rate of various types, and outputs all sorts of information about total flights and total mass. This model can be downloaded from my github at https://github.com/CHandmer/mars-cargo-model. But here are the key results.
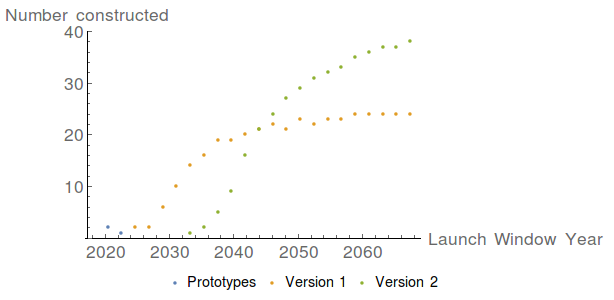
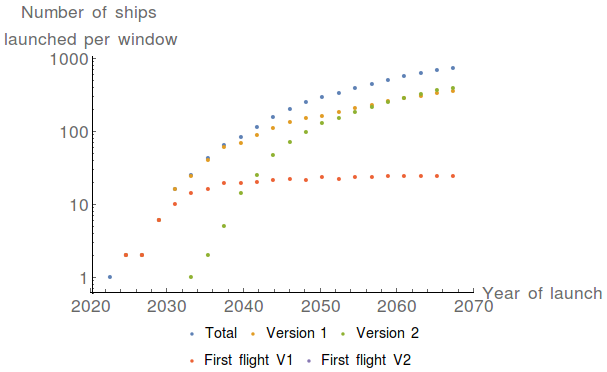
This is a reconstruction of build rate (per window) from the global manifest data. We see here that as Version 1 reaches rate Version 2 is in the early production phase, on a roughly 8 year design cycle. After 2042, Version 2 production dominates investment and an additional line is added.
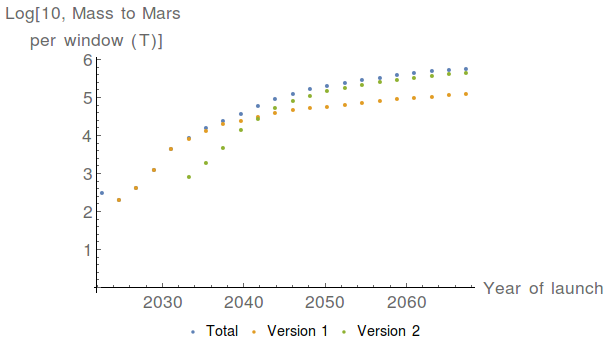
This graph shows how spaceship production and reuse increase the payload to Mars year over year. From 2042, Version 2 lifts the total throughput by nearly an order of magnitude.
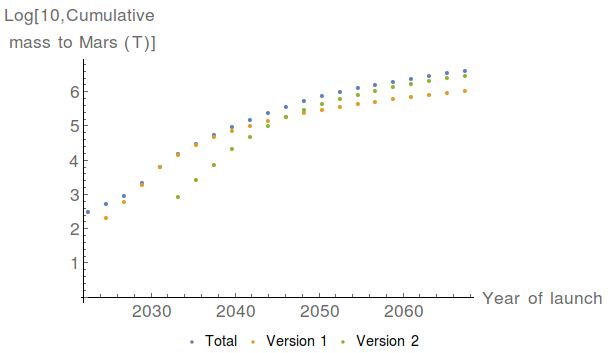
This graph shows the cumulative cargo transported to Mars, reaching the crucial million tonne mark in about 2052. Given that mass transport begins in 2027, this process takes only 25 years to achieve.
I had a couple of surprises when seeing the results of this model.
First, total payload capacity increases very quickly. The period of time for which an initial settlement is constrained by quasi-constant cargo capacity is basically non-existent. This actually makes sense heuristically, in that it's easier to build lots of spaceships on Earth than it is to build a complete industry in space. It has a positive consequence too, which is that if the general relation between population and mass independence is maintained, the overall population can be scaled up even more quickly than before.
The second surprise was that there is genuine utility to building a Version 2 spaceship with 3x the capacity - as it compresses the timescale to reach a million tonnes of cargo by 15 years.
So how quickly does the population scale?
This is another difficult question to answer, but assuming a population-industry trajectory like the red curve given in the first graph above, the total mass each sequential settler has to bring with them can be predicted and a population-mass relation extracted.
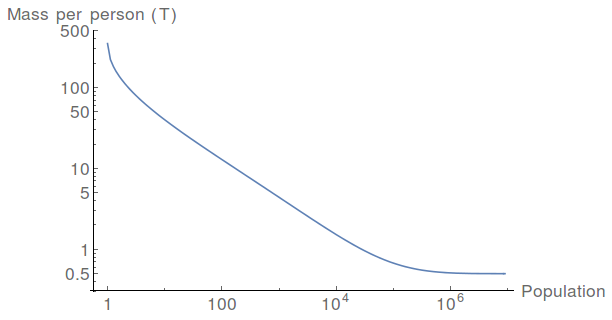
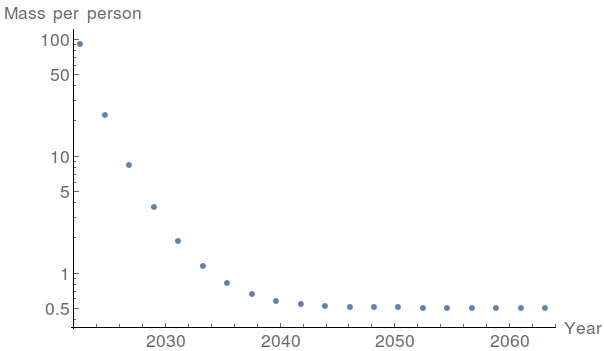
This graph shows the total mass payload per person, assuming that the first 10 people, landing in 2027, consume the 900T of payload then available, and that the residual payload is 500kg, enough for a person and the food they have to eat on the journey.
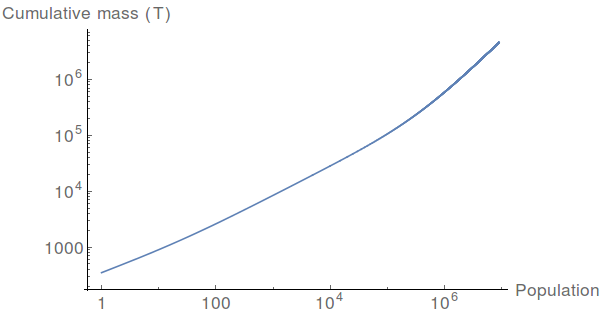
This graph shows how the cumulative mass shipped scales with population. The population reaches a million people as the cumulative mass hits 620,000 tonnes.
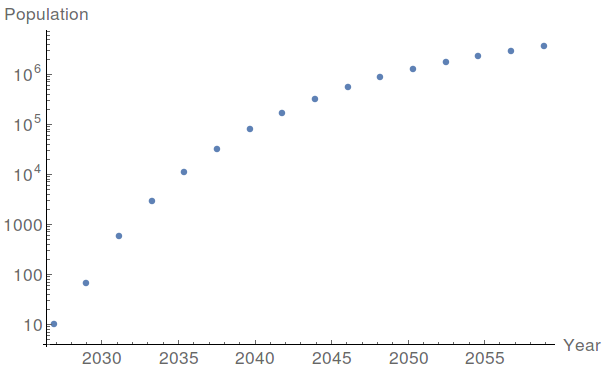
This graph shows how population grows as a function of time. Here, the population exceeds a million in the 2050 launch window, 23 years after first landing.
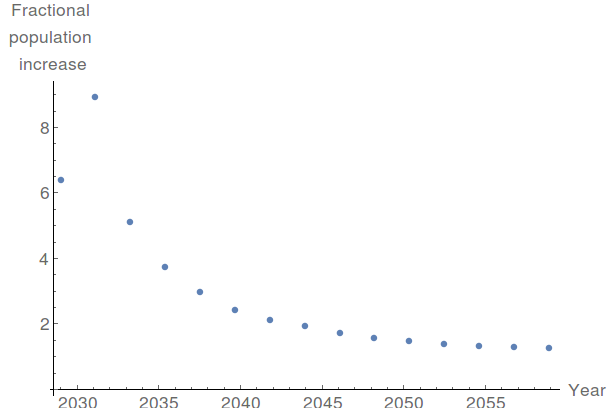
This graph shows the window over window fractional population increase. The population grows very rapidly in the first decade to around 10,000 people. This reflects the easy gains of rapidly increasing shipping capacity and gas/water processing for plastics and propellant. 10,000 people is enough to begin mining and processing of metal ores to complete the set of available Martian feedstocks for the development of advanced industry.
Window over window gains drop below 2 from 2045 as all available space in Mars ships is consumed with passengers. If further explosive growth is needed, more ships and more flights are needed to transport people.
What does it cost?
In the previous section we eliminated mass to discover the population-time relations. Here, we reslice the data to discover the mass per passenger on a launch window basis.
This graph shows that by 2033, cargo mass per passenger has fallen to about a tonne, putting a ticket within reach of a middle class family. Someone arriving in this launch window could be the 10,000th person on Mars, and will mark the transition from program-selected specialists to self-selected professionals.
In 2035, a Version 1 spaceship can carry about 300 passengers, each with a tonne of cargo. By 2044, a Version 2 spaceship can carry about 2000 passengers, each with 500kg of cargo.
Let's adopt some ballpark numbers. A version 1.5 spaceship+tanker+booster may be constructed for a price comparable to a modern composite passenger jet, say $500m. Each refit costs $100m (of which a tiny fraction is propellant), for a total lifetime cost over 16 reuse cycles of $2b, or $125m per flight. If this is split evenly in time and between 300 passengers in 2035, the per ticket cost is around $420,000. A version 2.5 spaceship+tanker+booster will cost $500m to build, $50m to refit, and fly 30 times. Split evenly, the per-ticket cost in 2044 is $33,000, for a $65m/flight total cost.
Unfortunately it is difficult to be more precise than this, due to multiple cascading uncertainties. By the onset of "general admission" tickets in 2035, many billions will have already been spent on development and construction of spaceships which may not recover their construction costs in regular service for decades.
That said, I can attempt to estimate development and construction costs. Design rate and cost for both spaceships is $500m and 20/window, which works out to around $4.5b/year. This starts at the beginning of the program, even if the production rate doesn't reach design rate until 8 years later. Thus construction costs alone reach $4.5b/year in 2022 and $9b/year in 2032.
Reuse costs are initially low due to low numbers of reused spaceships, but eventually dominate overall program costs. By this point, however, ticket revenue will effectively offset this cost, and eventually fund the construction of new ships and entire program.
The primary financial outlay, then, occurs between 2018 and 2040, and may total $132b at an average of $6b/year.
This graph shows how the number of ships built and launched varies over time. If refit costs are 20% building costs, then building costs dominate until about 2040, by which time general admission revenue can begin to cover much of the program's operating costs.
Model Limitations
This model is generated from rocket building history alone. It doesn't take into account any other aspect of the universe, including human mortality, accident rates, or the possibility of mission failure. While guessing numbers and adding them to the model is technically easy, I judge that it would greatly increase uncertainty (fudge factor) while not adding much insight. Model complexity is only useful up to a point.
Phase Two
Earlier, I defined phase one as the era of cargo constraint, and phase two as the era of accelerating returns. As we've seen above phase two has a different kind of restraint, namely an immigration capacity restraint. By 2045, the critical path for growth is how many people can fit on a Version 2 spaceship, although under nominal predictions a million people are reached only 5 years later, by 2050.
Here, I will wrap up by listing technology concepts that could lift this constraint and permit further high rates of growth into the future.
- Higher construction rate of Version 2. Constraints on construction and launch rate are so low that many thousands of ships could be launched every window. Construction rates could climb into the hundreds per year in a single factory. Ticket revenue could fund this, if a positive margin on launch business was maintained.
- Faster ships that can launch multiple times in longer launch windows. This requires better engines and better mass ratios, but eventually there could be cargo and people arriving year round.
- Entry of other companies and agencies into the bargain. Could achieve 10x, possibly 100x on rate.
On the flip side, I think it's likely that the minimum viable population requirement will shrink to the point that even small outposts will have the ability to reach full autarky.
Project Timeline
Mars 2020 - Aquifer search probes land, Version 0 ships performing atmospheric tests on Earth.
Mars 2026 - First 10 crew arrive, 3 ships on surface. They scale propellant plant, assemble a lot of base for new arrivals.
Mars 2030 - Middle of explosive growth phase, base population grows to near 1000. Pilots for all primary industries established.
Mars 2035 - First private and 10,000th settler arrives. Mars spaceport hosts dozens of Version 1 ships and the Version 2 prototype, looming over the rest.
Mars 2043 - Ticket prices fall below $100k and the population exceeds 100k. All secondary industries at least in pilot phase. "Mission accomplished"
Mars 2050 - Population on Mars exceeds a million. Dozens of outposts formed.
Mars 2060 - A web of towns and cities all over Mars, with the first base and by far the largest forming a sort of hub.

No comments:
Post a Comment
If you want to comment without a google or open-ID account, sign enough of your name that at least I know who you are, or leave an email address or bank account details or something.
Note: Only a member of this blog may post a comment.